My approach to strategy doesn’t depend on shower eureka moments, flashes of genius, or wearing a black turtleneck every day of your entrepreneurial career. It does depend on doing the work. A lot of it. Much of it will drive you a bit crazy second-guessing yourself. But if you put in the time and don’t get stuck in analysis paralysis, you can define a strategy you can actually execute to achieve your financial goals.
Strategy is knowing exactly what you want as an entrepreneur, the narrow group of customers you will serve who will reward you, how you will solve their problems in a distinctively better way than anyone else, and the 1 thing your company must do every 90 days to keep strengthening that advantage.
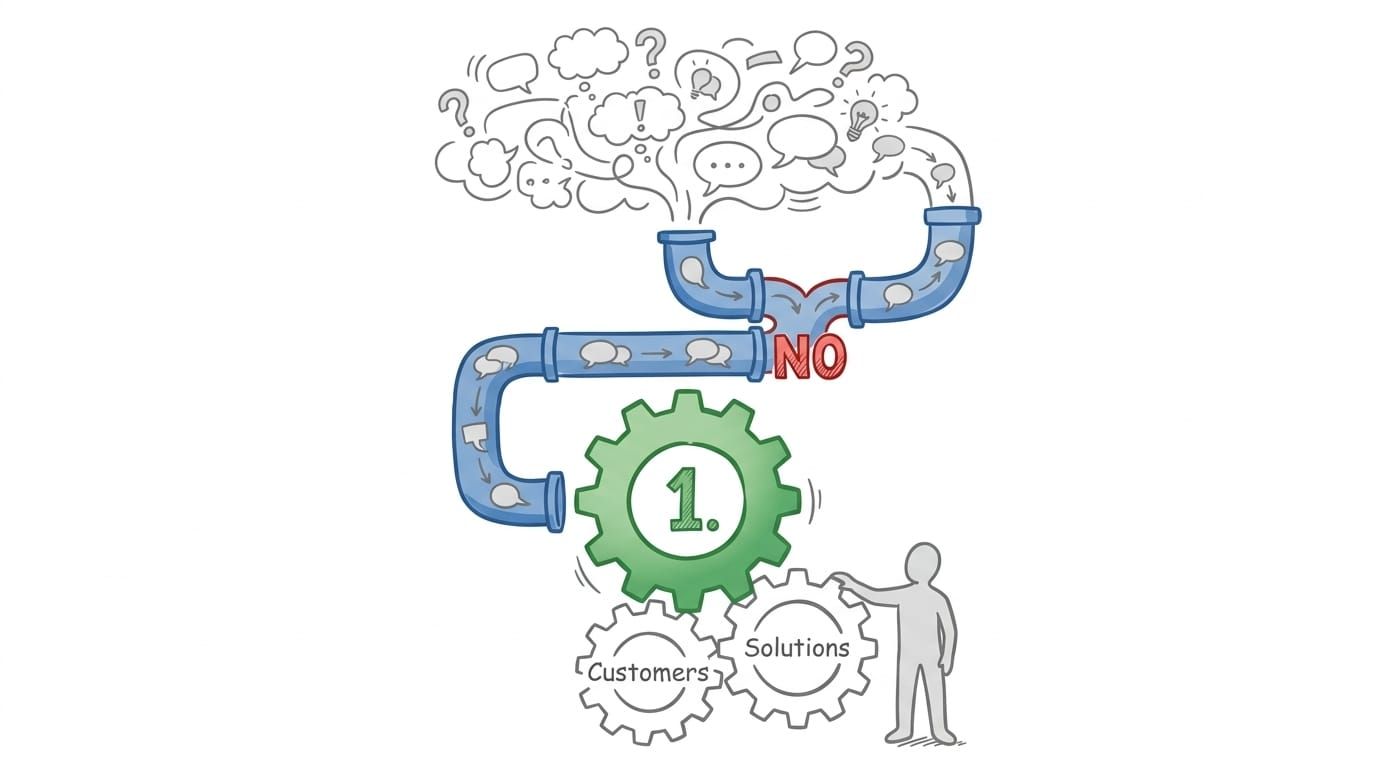
Here’s the hard part: you say NO to anything that doesn’t contribute to that plan and you commit to only 1 thing that matters every 90 days. Each 90-day improvement becomes a foundational block in your strategy wall. Once it is in place, it becomes part of your machine; you don’t have to rebuild it. It’s not a flavour-of-the-day idea you lifted from a podcast and threw at your company the moment you logged in. Everyone knows the 1 thing they are in service of for the next 90 days, and why. And, to be blunt, you don’t mess with it. It took me 5 years to fully implement our strategy, work I could have finished in 3, because I kept screwing with it instead of putting it in place, letting it run, and getting out of the way.
What I present here is a compilation of the work of many people I’ve been fortunate to learn from, with a few modifications of my own. Here’s the path we’ll follow:
- Purpose and 3 Year Targets – why you are doing this and what financially enables it.
- Target Market and Market Map – where you play and how that world is structured.
- Ideal Customer Profile and persona – who you want as many copies of as possible
- Customer Attribution Framework – where the ‘white space’ is and how you can truly be different.
- Activity Fit Map – how your real activities cluster into a small number of named Differentiators.
- Strategy On A Page – a simple summary of your strategy that everyone can remember and use to make daily decisions.
- Strategic Swim Lanes – the one big thing every quarter, for the next 12 quarters, you will singularly do, to fulfil your strategy.
Purpose
I believe that Entrepreneurs have a unique opportunity when it comes to defining the Strategy for their company. Unfortunately I also believe that most overlook this crucial step.
Strategy for an Entrepreneur begins with defining why you are in business. What is the Purpose of this thing you are building and are putting your time and attention into, and in the process very likely taking large risks and gambles. What do you want from this business that justifies all of this effort? For an entrepreneur step 1 is making sure you know what success looks like for you as I have outlined in my post here. Otherwise you may find yourself hating your boss (you) and the company that you made. Everything that follows – your Target Market, Ideal Customer Profile, and all of the other elements of Strategy – is in service of this Purpose.
3 Year Targets
With your Purpose in mind now define what must be financially achieved within 3 years to deliver it. These are top level numbers only and they do not have to be deadly accurate. It is absolutely fine to just make assumptions at this point, and then, assuming you implement a Business Operating System, you will revisit, apply lessons learned, and adjust every quarter for the next 12 quarters until you hit your 3 year target. Treat these as good-enough guesses that you will revisit quarterly, not promises etched in stone. Sketch out what you will need in terms of;
RevenueGross MarginProfit MarginGrowth RateProduct Units Sold (what is sometimes referred to as your economic engine, widgets, etc)Key Metrics (for your industry what measurements are critical to achieve your Purpose)
Your Target Market
Knowing what you want and the 3 year results that must be hit to achieve it you can now define your Target Market:
Narrow
Tight enough that it is easy for you to be a big fish in a small pond where your limited sales and marketing dollars can have enough impact to give you brand recognition. Yet big enough that the total available market can deliver the 3 year results that you want. Test it. Make sure you have gone as narrow as possible, but big enough to hit your goals. “SMBs worldwide” is not a Target Market. “Privately held B2B SaaS companies in North America with 20–50 employees and ARR between $2M and $10M” is getting closer.
Shared Problem
Your target has a shared problem, or job-to-be-done that you can solve. Preferably this problem is under served in terms of quality, price, or fit, and that is an opportunity for you. This shared need lets you build one offer, one message, one go-to-market motion that works repeatedly.
Geographic Fence
Put a fence around them geographically. If your product can serve a narrow industry worldwide and it has no regional requirements, multilingual demands, local laws and regulations to adhere to, cultural variations or high costs of delivery to reach all corners of the globe, and these ideal customers all gather in the same place so you can get maximum return on your marketing dollars, easily, then sure, you have a global product. I have yet to meet a company that truly has this, although many claim they do. Narrow your geography.
Reachable
Within your target geography you can readily reach them. They are in identifiable places; specific channels, lists, associations, platforms, events and roles. If you can’t build a list or a repeatable path to them, they’re not a practical Target Market.
Can Pay
Ability and willingness to pay. They have a budget, authority, and a business case that makes paying you rational. A “perfect-fit” user with no money is a persona, not a Target Market.
Strategic Fit
The last point to test your Target Market with – Strategic Fit – is a bit more nuanced. A Target Market is strategic if the opportunity to serve them with the product you are selling builds momentum in the direction you want, and is not just “who happens to be buying today”. There are many examples of strategic fit techniques to use and compare your market against, the following are what I know and have used and my interpretations of them are just that. I strongly recommend you read the original materials on each of them and look for other tools and techniques that you can take and make your own.
Strategic fit means that by serving this Target Market and the ideal customer within it (next section) you both make money and improve the overall position and momentum of your business. To assess the strategic fit of a target I look for at least 1 of the following to be clearly, credibly true:
Disruption opportunity; Clayton M. Christensen – The Innovator’s Dilemma: When New Technologies Cause Great Firms to Fail (Harvard Business School Press, 1997).
Does this segment give you a wedge where incumbents are overserving or underserving, so you can come in “good enough” on old dimensions and much better on the dimensions that now matter? If yes, this customer segment helps you move along a disruptive path, not just coexist.
Flywheel; Jim Collins – Good to Great: Why Some Companies Make the Leap… and Others Don’t (HarperBusiness, 2001).
Does winning and delighting this type of customer spin a repeatable loop: more proof, more trust, lower CAC, better unit economics, stronger brand, which in turn makes it easier to win more of the same? If yes, each new customer adds momentum, not just revenue.
Network effects; Michael L. Katz & Carl Shapiro – “Network Externalities, Competition, and Compatibility,” American Economic Review, 1985.
Does value for each customer increase as you add more customers, partners, data, or content on the same “graph”? This can be direct user-to-user value, or strong reputation and reference effects inside a tight community. If yes, the segment compounds in your favour.
Platform potential; Geoffrey G. Parker, Marshall W. Van Alstyne & Sangeet Paul Choudary – Platform Revolution: How Networked Markets Are Transforming the Economy—and How to Make Them Work for You (W. W. Norton, 2016).
Does serving this segment deeply give you a realistic path from product to platform: integrations, modules, or third-party offerings that customers would adopt on top of you? If yes, your leverage and switching costs improve over time.
Blue ocean space; W. Chan Kim & Renée Mauborgne – Blue Ocean Strategy: How to Create Uncontested Market Space and Make the Competition Irrelevant (Harvard Business School Press, 2005).
Does this segment allow you to change the basis of competition and create a distinct value curve, rather than fighting on the same feature/price grid as everyone else? If yes, you can defend margins and position more easily.
Secret Sauce; Does this Target Market give you the opportunity to build and reinforce a hard-to-copy system of choices and capabilities that competitors cannot easily replicate? This is not a single clever feature; it is the way you put things together – who you serve, what you refuse to do, how you deliver, how you support, the data you accumulate, the relationships you build – so that, over time, you win more, keep more, and grow more with this specific kind of customer. If you cannot see a credible “secret sauce” emerging for this market, or if any decent competitor could copy what you are doing in a year or two, that is a warning sign about strategic fit.
The above are just tools that can be used to think through your strategic fit. They are not exact sciences and I am sure there are many other frameworks that can be used that I do not know. The point of doing the strategic fit exercise is to identify the synergistic opportunity to serve this Target Market. If you have 1 or more of the above – disruption, flywheel, network effects, platform potential, blue-ocean space, and a real “secret sauce” system that this market makes possible – that is a strong signal of Strategic Fit for the Target Market you are going after. If a segment does not clearly light up at least 1 of these, or you cannot see a defensible secret sauce in it, treat it as non-core, even if the short-term revenue looks attractive.
Without a well crafted focus you get vague positioning (“we can help anyone”), fragmented marketing, and a Franken-product pulled in 10 directions. With a clear Target Market, you can focus messaging, channels, product decisions, and pricing around one group and become meaningfully better than generic alternatives.
My Experience
My former company, Rise Vision, which provided digital signage, serves as an example. At one point, we operated in over 118 countries, catering to hundreds of different industries. Essentially, we were trying to be "all things to everyone," which ultimately meant we were of no great value to anyone. Looking back, it's surprising that customers found any value in our offering, given how fragmented our focus was. Compounding the problem, we lacked a strategy to effectively market ourselves across this vast expanse, meaning we were merely waiting for growth rather than actively initiating it. And, while it may be obvious, it must be stated: our profits were abysmal.
Eventually, I woke up. We went through all of the data that we had on our customers to identify who we sold to that churned the least, who we won in competitive situations most often, had a collective problem we could solve, they gathered together often, had a budget - especially ones that were recession proof, and there was more than enough of them to satisfy our 3 year targets. We had a strong presence by way of default in education predominantly in North America, but also globally, and this included everything from Kindergarten up to Higher Education. My first reaction, because I was desperate, was to say “we serve education”. This was delusional. The needs of education are very different around the world - problems to be solved, languages, reachability, etc. etc. They are not the same. And, in digging deeper we further realized that the needs of Higher Education were far more complex and that those opportunities were way more competitive. K-12 in North America was underserved, there was a disruption opportunity, especially if someone focussed exclusively on their needs, and schools tended to follow schools.
With great trepidation and fear I resigned myself to only focus on K-12 digital signage in North America. We would say no to everything else, and invest in 4 “content” differentiators, that are unique to schools, and only available from us;
- Gather; The more people who contribute, the greater the ownership & pride, Δ more referrals that move the flywheel
- Create; The better their content looks the more it gets noticed, Δ more referrals that move the flywheel
- Curate; The easier it is to update, the more often it is updated, the more often it changes, the more it is noticed, Δ more referrals that move the flywheel
- Deliver; The wider the delivery, the more it is noticed, Δ more referrals that move the flywheel
The combination of these differentiators, our competitive price point, and our focus on providing the best vendor experience they’ve ever had, created a moat that could not be easily crossed (the secret sauce) and it set our flywheel in motion;

The end result was that we had a strong strategic fit with our Target Market. It spun a real Collins-style loop (better content plus “Best Vendor Experience” → more successful implementations and referrals → more schools) and created local network effects as “schools follow schools” and districts standardized on one solution. Once we became the district communication standard, that opened a credible platform path. “Best Vendor Experience” meant handling schools’ high-touch needs better than anyone else, rigorously measured by NPS and Touch analysis (Bill Price and David Jaffe, The Best Service Is No Service: How to Liberate Your Customers from Customer Service, Keep Them Happy, and Control Costs). Our disruptive, quasi–blue-ocean position came not only from being simpler and cloud-based than legacy AV/signage, but also from avoiding the bloated, over-featured and expensive systems of digital signage competitors, providing school-specific content, and crucially solving the fact that schools had neither the time nor resources to create that content themselves.
Where Are We Playing - Market Map
With your Purpose, 3 Year Targets, and Target Market defined, the next step is to see the game you are actually playing. Shannon Susko’s Market Map from 3HAG is the tool I use for this. It is a one-page picture of your playing field. It should include customers, channels, geographies, competitors, substitutes, and influencers. You are trying to capture the real ecosystem your Target Market lives in, not the simplified version in your head.
On the demand side of the map you list your core customer segments, the channels and partners that bring them to you, and the geographies where they sit. On the supply side you list key suppliers and platforms you depend on: technology, content providers, hardware, data, and so on. Around that you place direct competitors and the substitutes your customer could choose instead of you, including “do nothing” and “build it themselves”. Finally, you annotate the map with the risks and opportunities you see: where customer concentration is too high, where a supplier has too much power, where a new entrant or substitute might appear, and where there are gaps no one is serving well.
The Market Map is also a sanity check on your Target Market. Once you have drawn the map, you can see very quickly whether reaching your chosen Target Market is practical or fraught with risks and barriers. If the path to that Target Market runs through too many gatekeepers, hostile channels, concentrated competitors, or platform dependencies, you have probably chosen the wrong target. In other words, the Market Map reconciles your theory with reality. Once it is done, you may want to revisit and refine the Target Market until you are satisfied that there is a clear, de-risked path through the map to the customers you want.
The Market Map can also surface attributes that should be elevated in what Shannon Susko calls the Customer Attribute Map (what I refer to here as the Customer Attribution Framework). That framework is simply a way of listing the attributes that matter most to your core customer (for example ease of setup, quality of support, freshness of content, price simplicity) and then scoring yourself and your competitors on those attributes today, and where you want to be in the future. I describe it in detail later, but the important link here is this: if a problem or opportunity on the Market Map can be addressed by improving, or consciously divesting from, a specific attribute, then that attribute becomes more important in the Customer Attribution Framework. For example, if a risky dependency on a channel or supplier shows up on the map, you can ask: is there an attribute we could raise or lower that would reduce that risk or exploit that opportunity? When the answer is yes, that attribute moves to the top of the list for your “Future Us” line. In this way, the Market Map does more than sanity-check the Target Market; it directly informs which attributes you choose to win on, and which you deliberately let go.
If your Purpose is to be acquired, the Market Map gets one more important layer. In my post “How I Would Sell A Business” I talk about adding potential strategic acquirers directly onto the map. Who are the strategic acquirers in your industry that would value what you do? Strategics will pay more. Put them on the map exactly where they are strong today: which segments, channels, geographies, or technologies they already own, and then mark the gaps they have. Your job over the next 3 years is to build a position in the map that makes you uniquely valuable to those acquirers: dominating a core customer segment they want, owning a channel or geography they lack, solving a problem their current offer cannot, or creating a data or content asset that plugs straight into their system. What you learn from this can and should influence your Customer Attribution Framework as well. If a particular acquirer clearly values certain attributes, or has obvious gaps that could be filled by you being exceptional on a small set of attributes, that should show up in how you choose and weight those attributes in your “Future Us” line.
The Market Map is not a poster, it is a working document. You should be able to point at it and answer a few simple questions: Where are we now? Where do we want to be on this map in 3 years? Which parts of the map will we ignore, even if someone is willing to pay us, because they do not fit our Target Market or strategic fit? And, if we want a particular strategic acquirer to care about us, what has to change on this map between now and then? Once you can answer those questions, you are ready for the next step in the sequence: defining your Ideal Customer Profile and persona inside this map, and then using the Customer Attribution Framework to decide exactly how you will be different for them, which attributes you will say no to, and which attributes you will commit all of your resources to winning.
Your Ideal Customer
With your Target Market chosen and your Market Map drawn and sanity checked, the next step is to define your Ideal Customer Profile (ICP). The Target Market says “this is the field we are going to play on”; the Market Map shows how that field is structured and where the risks and opportunities are; the ICP defines exactly which customers on that field you want as many copies of as possible. The persona is the human face of that ICP. For Rise Vision, the Target Market became “K-12 schools in North America that need to communicate with students, staff, and parents and are willing to invest in digital signage.” The Market Map confirmed that this part of the world was reachable, not already locked up by entrenched channels, and had clear gaps in content and support. Inside that, the ICP and the primary persona were defined using StoryBrand (Donald Miller, Building a StoryBrand: Clarify Your Message So Customers Will Listen, Nashville: HarperCollins Leadership, 2017) so that the strategy, product, and narrative all aligned. The primary persona for us was “Clay, the school IT guy,” and everything we did was ultimately in service of Clay.

At the account level, the ICP for Rise Vision looked like this: public or private K-12 schools and districts in the US and Canada, with multiple displays or locations; limited in-house marketing or design resources; real communication pain (safety, announcements, culture, parent engagement); budget for a SaaS subscription; and a bias toward standardizing on one simple, cloud-based solution that “just works” rather than tinkering with complex hardware and custom builds. Crucially, inside those schools there was an overworked, under-appreciated IT person who was expected to “make digital signage happen” on top of everything else and needed a solution that would not turn into another ongoing project. Those customers stayed longer, expanded more, and referred more. That is the analytical side of the ICP: who they are on paper (type of school, size, number of locations), how intense their problem is, what the unit economics look like, how well they fit your strategic direction, and where they sit on your Market Map. If a cluster of customers looks attractive in isolation but sits in a hostile part of the Market Map – controlled by a gatekeeper channel, dominated by a strategic you cannot displace, or burdened by risks you cannot afford – they do not belong in your ICP.
Clay is the human embodiment of that ICP. “Clay, the school IT guy” is time-poor, short on resources and budget, and under pressure to keep everything running. His external problem is “I need to implement digital signage with almost no time, budget, or staff.” His internal problem is “if this goes badly I look incompetent and get more work dumped on me.” His philosophical problem is “technology is supposed to make my life easier, not harder.” Rise shows up in Clay’s story as the guide who understands that he is time-poor and risk-averse, offers a simple step-by-step plan (sign up, plug in the player, pick templates, invite contributors), and paints a success state in which digital signage is deployed quickly, content stays fresh without Clay doing the work, and he looks good to the principal and district. Failure in that script is also clear: Clay picks a complex, over-featured system with no school-specific content, the screens die after a few weeks, and he becomes the help desk for a failed project.
StoryBrand wraps that ICP and persona in a clear story. In StoryBrand terms, the ideal customer is the hero, not the product. For the ICP above, the “hero organization” is a school or district that wants students, staff, and parents to be informed and engaged, but feels overwhelmed by the time and skills required to keep content current. Its external problem is dead or out-of-date screens. Its internal problem is the frustration and embarrassment of not communicating well. Its philosophical problem is “schools that care about their community shouldn’t have to fight their tools to keep everyone in the know.” In the story, Rise is the guide, not the hero: it brings credibility, empathy, and a simple plan (set up the screens, pick from school-specific templates, we gather/create/curate/deliver content every week) and a clear picture of success (fresh, relevant content everywhere, community “in the know”) versus failure (blank screens, complaints, safety messages missed). None of this changes who is in the ICP; it forces you to describe the ICP’s world in their own language, and in the context of the ecosystem you have already mapped.
For us, adopting StoryBrand was not a cosmetic marketing exercise; it changed how we thought and spoke as a company. Before StoryBrand, we endlessly talked about ourselves and how great we were, in language that meant nothing to the customer. After StoryBrand, we disciplined ourselves to only talk about how we empathized with the problem our customers had and the plan to solve it. That shift changed everything. We would meet customers who would literally use our brandscript to describe what they needed. They identified with it so easily that our words became how they described their own needs back to us. Internally, it gave us a simple test for every decision: would our persona – Clay – think that what we are about to do actually solves his problem? If the answer was no, we did not do it. We read the book, took the courses, hired certified implementors, and trained the entire company on this approach. In hindsight, it was one of the most significant changes we made and a major contributor to our success.
If you can’t say NO, you don’t have a strategy.
The combination of a hard, Market-Map-informed ICP definition and a StoryBrand script for Clay is the point. The Target Market tells you where you play. The Market Map tells you how that world is structured and where the real risks and opportunities lie. The ICP defines exactly which customers on that map you want more of. Clay makes that ICP human and emotionally real so that product, marketing, sales, and support can all tell the same story. For Rise Vision, that meant saying no to all non–K-12 opportunities, no matter how tempting, and this required unbelievable discipline. The hardest part of committing to a strategy is not writing it down, it is saying no to everything else that comes at you after that; if you won’t say no, you do not have a strategy. In practice, we designed the product so Clay could succeed quickly, built content services that solved the school’s lack of resources, and measured “Best Vendor Experience” with NPS and Touch analysis so that Clay’s story really did end in success. The clearer the Target Market, Market Map, ICP, and persona plus StoryBrand narrative, the faster the flywheel spun and the harder it was for competitors to copy what actually mattered.
Create White Space - Customer Attribution Framework
Once you have defined your Target Market, drawn your Market Map, and built out your Ideal Customer Profile and persona, the next step is to decide exactly how you will be different in that market. Shannon Susko’s Customer Attribute Map from the 3HAG Way (what I refer to here as the Customer Attribution Framework) is the tool I use for this. It is a structured way to see, on one page, how your core customer views you and your competitors across the attributes they actually care about, and where the “white space” for differentiation really is. It connects your strategy directly to what your ideal customer is willing to pay for, and to the structural realities you uncovered on your Market Map.
In simple terms, the Customer Attribution Framework is a list of the attributes that matter most to your core customer, with each competitor (including you) scored against those attributes. Attributes are just the dimensions customers use, consciously or not, to compare options: ease of setup, time to value, reliability, quality of support, freshness and relevance of content, security, price, contract flexibility, and so on. You build this list from three inputs: your ICP and persona (what Clay actually cares about), your Market Map (where risks and opportunities sit in the ecosystem), and the strategic acquirers you have placed on that map (what they would value you for). For example, if the Market Map shows a risky dependency on a single hardware supplier, “hardware flexibility” or “platform independence” might become explicit attributes. If a strategic acquirer has a clear gap in school-specific content or support, those attributes move higher up your list.
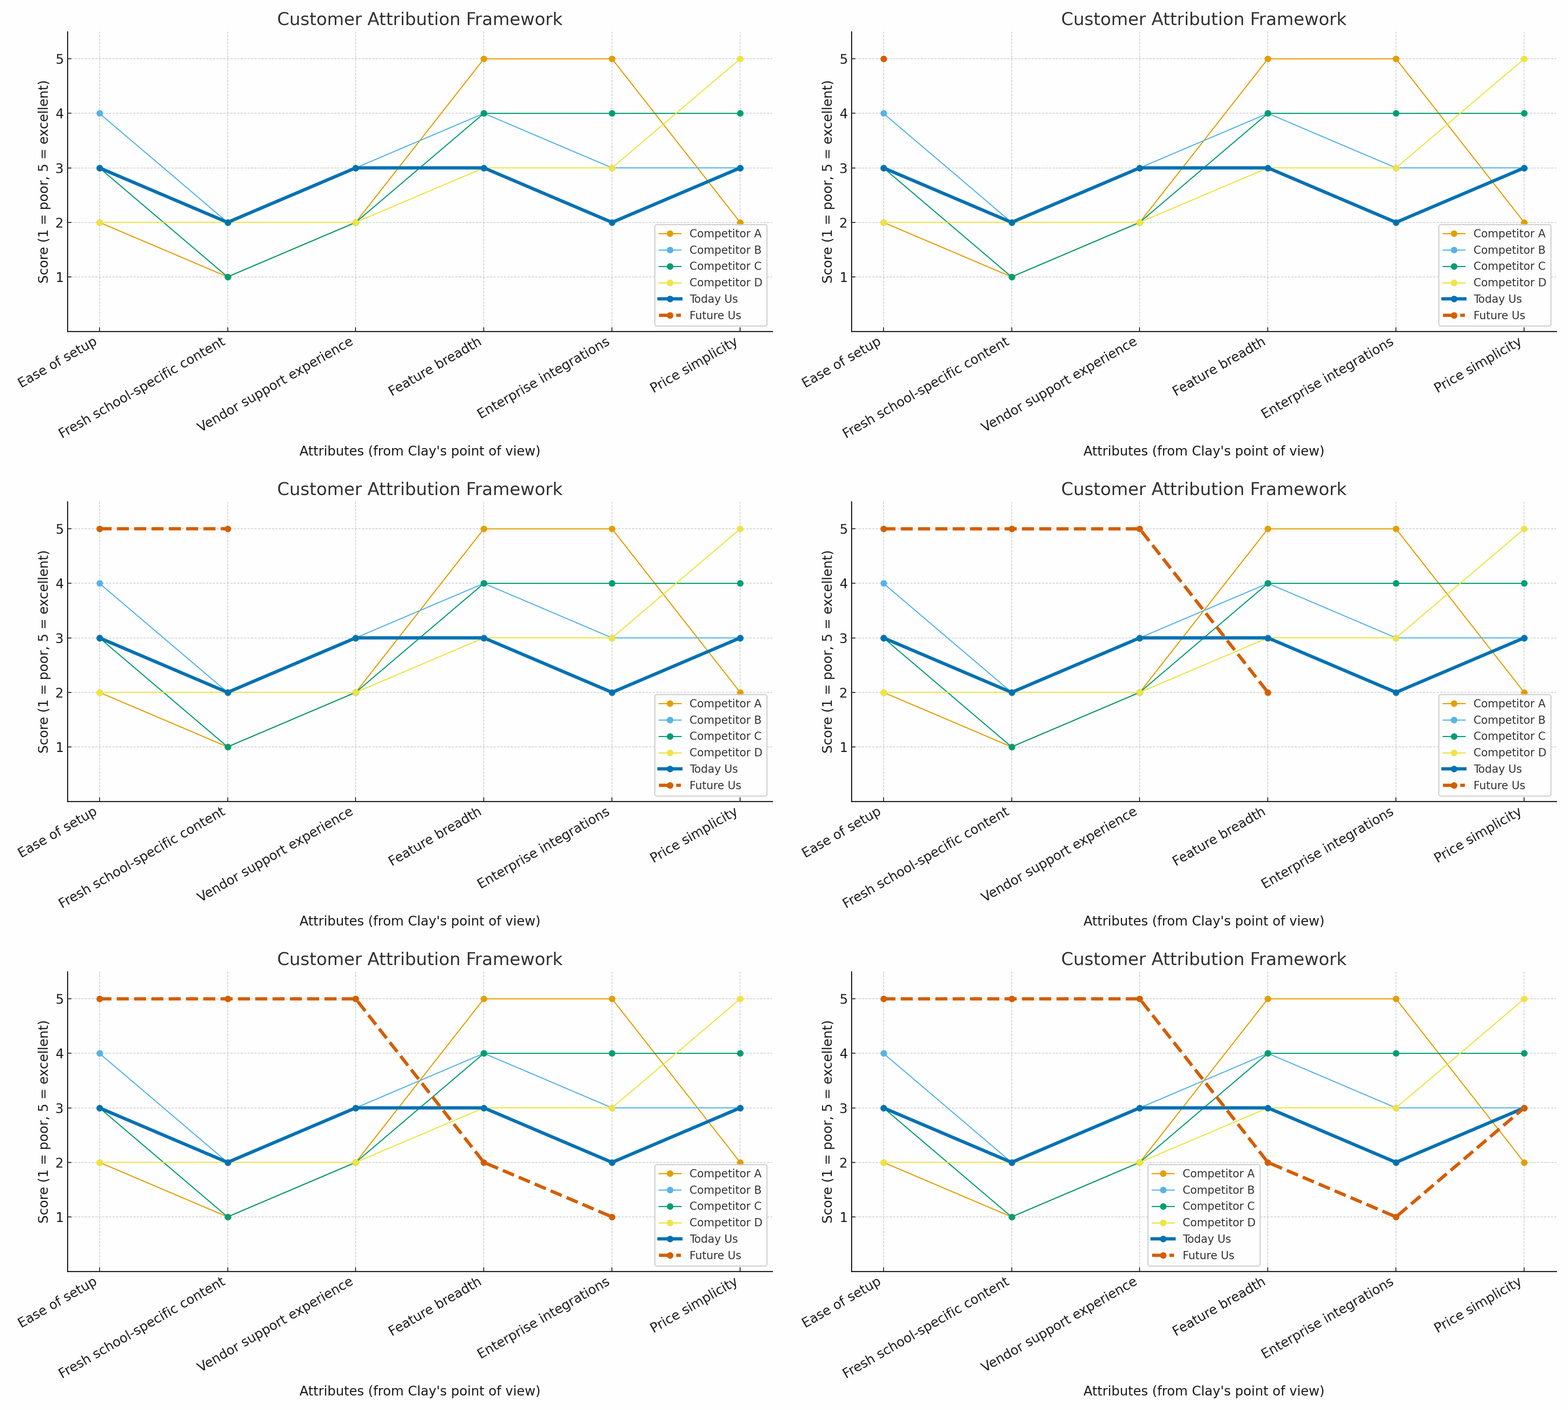
For this to be useful, you still start from your core customer and persona, not from your product. In the Rise Vision context that meant starting with Clay, the overworked, under-appreciated school IT person inside a K-12 school or district in North America who had been told to “make digital signage happen.” We listed the attributes of a digital signage solution that Clay and his principal actually cared about: how quickly Clay could get the system running, how easy it was to manage ongoing, how often the screens would have fresh, school-specific content, how good the vendor support was when something went wrong, and whether the total cost fit into a school budget without a bureaucratic nightmare. Those attributes also lined up with what we saw on the Market Map: competitors over-indexed on complexity and raw feature breadth, channel partners had power, and schools were under-served on content and support.
The first line you draw on this map is “Today Us.” You score yourself as you serve the market now, from your core customer’s point of view. Not how you wish you were, not how your marketing deck describes you, but how Clay would realistically rate you today on each attribute. You do the same for your main competitors and, if you want to be thorough, for key substitutes as well. A complex, feature-heavy enterprise system might score high on customization and low on ease of setup for a school; a cheap, do-it-yourself solution might score high on price and low on support and reliability. When you plot these lines, you see where everyone is bunched together, competing on the same things, and where there are gaps – attributes that matter to Clay but where nobody is currently strong.
The most important step, and where this becomes strategy rather than analysis, is drawing a second line: “Future Us.” In 3HAG language this is your three-year-out position. You create a new line that shows how you want your core customer to score you in the future, still on the same set of attributes and still from their point of view. This new line, compared to Today Us, to competitors, and to the risks and opportunities on your Market Map, creates your white space. It forces you to make explicit trade-offs: on which attributes will you deliberately pull ahead, on which will you be merely good enough, and on which will you consciously stop investing. If you think you can invest in everything and be great at everything, you are delusional. Once again, strategy is about saying no. The real power of the Customer Attribution Framework is that it makes you choose what attributes you will say no to, so that you can say yes, with all the resources you have, to the few attributes you most want to be known for – and that best reduce the risks and exploit the opportunities shown on your Market Map.
For Rise Vision, looking at the attribution map in the context of our Market Map made the choices obvious. Competitors were over-investing in complexity and feature checklists and under-serving schools on content and support. Our “Future Us” line committed to being outstanding at school-specific content (created for schools, not by them), freshness of that content through our Gather / Create / Curate / Deliver system, and “Best Vendor Experience” for Clay, measured relentlessly by NPS and Touch analysis. We accepted being merely good enough on raw feature breadth and some advanced enterprise capabilities, and we consciously stopped chasing large, complex, non-K-12 deployments that sat in the wrong parts of the Market Map. That meant divesting from certain product ideas, integrations, and segments so we could pour our effort into the attributes that would actually matter to Clay, strengthen our position for potential acquirers, and deepen our “secret sauce” for the K-12 Target Market. The combination of attributes we chose to own became a concrete expression of our advantage in this market.
The Customer Attribution Framework is not a one-time workshop exercise; it is a living part of your Business Operating System. As you learn more about your core customer, watch competitors move, and update your Market Map, you revisit the attributes, rescore your Today Us line, and check whether the Future Us line you drew is still the right one. In the 3HAG system those chosen attributes then flow into an Activity Fit Map (how your internal activities reinforce those attributes) and into 12-quarter “swimlanes” of work that make them real. Adopting 3HAG as part of our operating system at Rise Vision changed everything. It gave us a clear, testable picture of where we were, where we were going, what we had to stop doing to get there, and how all of that lined up with the realities on our Market Map. I strongly encourage you to read Shannon Susko’s materials on the 3HAG Way, study her Customer Attribute Map, and, if you can, work with someone who has implemented it before.
Used properly, the Customer Attribution Framework forces you to do three hard but essential things. First, it makes you see your market the way your core customer does, not the way you wish they did. Second, it forces real trade-offs: you pick a few attributes to dominate and consciously accept being average or even below average on others, rather than chasing every possible feature. Third, it ties your earlier strategic work together. Your Target Market tells you where you play. Your Market Map shows the structure of that game. Your ICP and persona tell you who you are playing for. The Customer Attribution Framework tells you exactly how you will be different and better for that specific customer in that specific market, today and three years from now, and gives you a practical way to say no to everything that does not move you toward that future line.
Now What? Activity Fit Map
Once you know who you serve (Target Market and ICP), how the world around you works (Market Map), and what “Future Us” looks like on the Customer Attribution Framework, the next step is to decide what you could actually do – or stop doing – to make that future true. Shannon Susko’s Activity Fit Map from 3HAG is the tool for that. It is her very practical adaptation of Michael Porter’s “activity system” idea, and in my interpretation it forces you to brainstorm possible activities that would move your Future Us line, then see how they naturally cluster into a few Differentiators.
To identify the activities that you could complete to enable your strategy, ask a simple question for each attribute in your Future Us line: “What activities could we do, or stop doing, that would materially change this score for Clay?” Each answer goes on a sticky note as a candidate activity. Some of those will be things you already do and need to strengthen; others will be new activities you have never done before; some will be things you might have to stop doing to free resources. For Rise Vision, for example, candidate activities included: designing and shipping K-12 template packs on a fixed cadence; automating content feeds tied to the school calendar; simplifying device setup so Clay could activate a display in minutes; building monitoring and alerting so we could tell Clay about issues before he found them; embedding NPS and Touch analysis into every support interaction; and deliberately not building complex enterprise-only features that did nothing for K-12.
Once you have a wall of these “could do / could stop” activities, you group them where they are similar or clearly reinforce each other. You are looking for natural “clumps” of work that hang together around a meaningful outcome. One cluster might contain all the candidate activities related to keeping content fresh and relevant for schools. Another might group all the activities that make setup and reliability effortless for Clay. A third might group everything that would create the Best Vendor Experience – how you respond, how you measure, how you close the loop. In a different business, clusters might form around “fast and reliable delivery”, “expert guidance”, “easy to buy from”, “category leadership”, and so on.
Then you give each cluster a name. Those names are your Differentiators. In our case, the content cluster became our content engine (later expressed as Gather / Create / Curate / Deliver). The setup and reliability cluster became “Easy to set up and keep running”. The support cluster became “Best Vendor Experience”. These are no longer vague aspirations; they are labels for specific sets of potential activities you are willing to commit to in order to move your Future Us line. The Activity Fit Map does not start from abstract attributes and try to force activities underneath them. It starts from “what could we do or stop doing to change these scores”, groups those candidate activities where they naturally fit, and then names those groupings as Differentiators.
Only after you have those named clusters do you reconcile them with everything upstream. You ask: do these Differentiators actually move the attributes where we have decided to win for our ICP and Clay? Do they reduce the risks or exploit the opportunities we saw on the Market Map? If a cluster cannot be connected to attributes and market realities that matter, it is probably operational noise, not a Differentiator. If an attribute you wanted to win on has no meaningful cluster of candidate activities behind it, you either need to add those activities (and create a Differentiator), or admit that attribute is wishful thinking and remove it from your Future Us line.
When you do this properly, three things happen. First, you see gaps. There are future scores you want that have very little activity behind them; that tells you the work is not real yet. Second, you see noise. There are candidate activities that do not fit any Differentiator cluster and do not meaningfully support your Future Us; those are things you should probably stop or never start. Third, you see reinforcement. You can now point to a small number of Differentiators, each backed by a tight, mutually reinforcing set of possible activities that, if executed, would actually change the game for your ICP. That is the beginning of a real “secret sauce”.
Most importantly, the Activity Fit Map reconciles everything that came before it. It is where the Target Market, Market Map, ICP and persona, and Customer Attribution Framework all have to agree with what you are prepared to do – and not do. If the clusters of candidate activities that really make sense for your team do not line up with the attributes you thought you would win on, or with the risks and opportunities on your Market Map, something upstream is wrong. You may need to revisit the Attribution Framework (are we trying to win on the wrong things?), the ICP (are we actually set up to serve a different customer better?), or even the Target Market and Market Map. The process is circular, not linear. You keep looping until the outside world (Market Map), your strategic choices (Target Market, ICP, Customer Attribution Framework), and your inside world (the clusters of activities you call Differentiators) all line up.
Strategy on a Page
Once you have a Target Market, Market Map, Ideal Customer Profile and persona, a Customer Attribution Framework with a clear “Future Us” line, and an Activity Fit Map that clusters your work into a small set of Differentiators, you already have a strategy. The challenge is that no one on your team has the time or patience to reconstruct all of that thinking every time they make a decision. To make the strategy usable in the real world I compress everything above into six simple lines that fit on one page: Our customer, Their problem, Our difference, Our promise, Our guarantee, Our strategy. At the time that I owned Rise Vision this distilled down into;
Our difference; We serve K-12 to keep everyone in the know while giving them the best vendor experience they’ve ever had.
Our customer; K-12 schools that need to communicate with staff, students, parents, and their wider community.
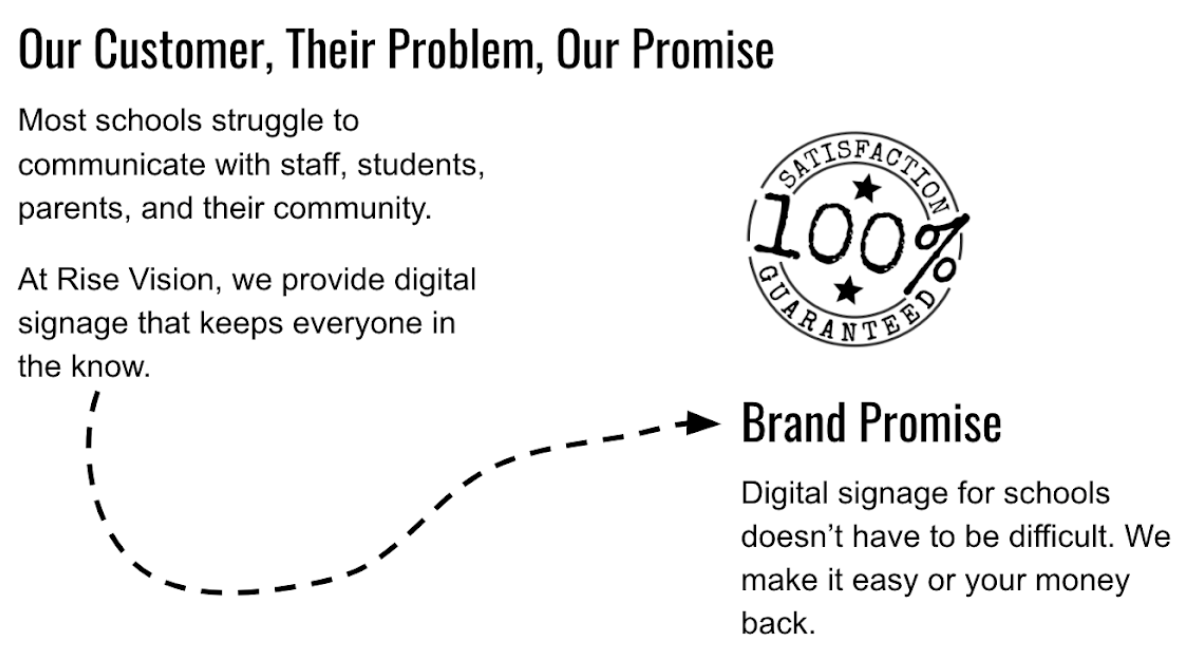
Their problem; Most schools struggle to communicate with staff, students, parents, and their community.
Our promise; We provide digital signage that keeps everyone in the know.
Our guarantee; Digital signage for schools doesn’t have to be difficult. We make it easy or your money back.
Our strategy; Achieve our Purpose and live our Values to be the solution of choice for K-12 digital signage in North America by Sep-2022 by focusing on K-12 and only investing in differentiators—gather, create, curate, and deliver—that are unique to them and only available from us; the combination of these differentiators, a competitive price point, and providing the best vendor experience creates a moat and sets the flywheel in motion.
“Our customer” is a plain-language statement of your core customer: the specific type of organization and buyer you most want “more copies of.” It should match the Core Customer / ICP work you have already done, not introduce something new. This line is heavily influenced by Verne Harnish’s notion of “Core Customer” and Sandbox in the 7 Strata of Strategy (Verne Harnish, Scaling Up: How a Few Companies Make It… and Why the Rest Don’t, Ashburn, VA: Gazelles Inc., 2014), by Shannon Byrne Susko’s Core Customer in 3HAG Way (Shannon Byrne Susko, 3HAG Way: The Strategic Execution System that ensures your strategy is not a Wild-Ass-Guess!, Vancouver: Ceozen Consulting Inc., 2018), and by Robert H. Bloom’s “WHO” in The Inside Advantage (Robert H. Bloom, The Inside Advantage: The Strategy That Unlocks the Hidden Growth in Your Business, New York: McGraw-Hill, 2007).
“Their problem” names, in one or two sentences, the core external and internal problem your customer is trying to solve. This is where the StoryBrand influence is explicit: Donald Miller’s SB7 framework starts with a Character (the customer) who Has a Problem before they can get what they want (Donald Miller, Building a StoryBrand: Clarify Your Message So Customers Will Listen, Nashville: HarperCollins Leadership, 2017). The external problem is the visible, practical issue (for example “our screens are blank or out of date”); the internal problem is how that makes your customer feel (“we look disorganized and incompetent”). This line should read like something your ICP would actually say out loud, not like marketing copy.
“Our difference” is the human-readable label for the “secret sauce” you uncovered in your Activity Fit Map: the handful of Differentiators where your clusters of activities reinforce each other and actually matter to your ICP. Conceptually this is sitting on top of Harnish’s “Differentiating Activities” and X-Factor in the 7 Strata, Susko’s five strategic Differentiators and Activity Fit Map in 3HAG, and Bloom’s “WHAT” – the uncommon offering you can own in the market. It should not be a list of features. It is a short sentence that answers “what do we do differently, for whom, in a way competitors will struggle to copy?”
“Our promise” is your Brand Promise: the specific, measurable outcome your core customer can expect if they choose you. In Scaling Up and 3HAG this is typically expressed as three Brand Promises tied to a Core Customer and measured with clear KPIs; Bloom’s “HOW” – the persuasive strategy that sells the uncommon offering to the core customer – plays the same role. Here I force it into one simple line. It should be a result (“we keep everyone in your school in the know”) rather than an activity (“we provide software and services”).
“Our guarantee” is the Brand Promise Guarantee or catalytic mechanism that makes it hurt if you fail to keep the promise. Harnish treats this as a distinct stratum in the 7 Strata of Strategy – the Domino’s “30 minutes or it’s free” style commitment that puts real skin in the game – and uses it to discipline both pricing and execution. Susko’s 3HAG implementations do the same thing by tying guarantees to the most important Brand Promises. In practice this line answers “how do we de-risk this choice for our customer, in a way that reinforces our advantage instead of eroding it?” It should be real enough that you would feel it if you had to honour it, but designed so that living your Differentiators makes it very unlikely you need to.
“Our strategy” is the synthesis line. It ties together your Purpose, Target Market, Differentiators, and flywheel into one statement that a human being can remember. It is influenced by Harnish’s “One-Phrase Strategy” and Profit per X, by Susko’s three-year “Future Us” 3HAG and strategic swim lanes, and by Bloom’s “OWN IT” – the imaginative acts by which you make your Inside Advantage famous. A good test is whether this line could reasonably finish the sentence: “We will achieve our Purpose by becoming the obvious choice for [our customer] who have [this problem], by [our difference], backed by [our promise and guarantee], executed through [the few big things we are prepared to do and not do].”
None of the labels or ideas in this “Strategy on a Page” template are original. It is simply a house synthesis that puts into one place: Core Customer, Brand Promises, Brand Promise Guarantee, Differentiating Activities, and One-Phrase Strategy from Scaling Up’s 7 Strata; the three-year Future Us line, Customer Attribute Map, and Activity Fit Map from 3HAG Way and Metronomics; the WHO / WHAT / HOW / OWN IT structure from The Inside Advantage; and the Character / Problem / Success / Avoid Failure elements of Donald Miller’s StoryBrand. What is original, if anything, is the insistence that all of that work must resolve into six short sentences that a real person in your company can remember and use to make decisions without having to reread this entire document.
Get It Done - Strategic Swim Lanes
By the time you reach Strategic Swim Lanes you have five critical pieces in place:
- Purpose and 3 Year Targets – why you are doing this and what “good enough” looks like.
- Target Market and Market Map – where you play and how that world is structured.
- Ideal Customer Profile and persona – who you want as many copies of as possible (for Rise Vision: K-12 schools in North America with an overworked IT person, Clay).
- Activity Fit Map – how your real activities cluster into a small number of named Differentiators.
- Strategy On A Page – the summary of your customer, their problem, your difference, promise, guarantee, and strategy so anyone on the team can make daily decisions without rereading the whole plan.
Strategic Swim Lanes simply carry those Differentiators forward in time, for that specific ICP and persona.
From the Activity Fit Map you take each Differentiator – the named clusters of activities that make up your “secret sauce” for your ICP – and give it its own horizontal lane on a 12-quarter (3-year) timeline. For Rise Vision, using the same examples that aligned with our Customer Attribution Framework and Activity Fit Map, those Differentiators were: Ease of setup, Fresh school-specific content, and Best Vendor Experience. Along the top of the chart are Q1 through Q12. Down the side, each row is one of those Differentiators carried forward from the Activity Fit Map.
Where I differ from Shannon Susko, and this is explicitly my opinion, is in how many strategic deliverables you should have at once. I believe there is no priority if there is more than one priority. For that reason, across all of the Differentiator lanes, I only allow one true strategic deliverable per quarter. Everything else is either enabling work for that deliverable or day-to-day operations. This is where strategy becomes real: you say no to anything that does not meaningfully contribute to that one thing for the next 90 days.
A strategic deliverable here is a single outcome that clearly strengthens at least one Differentiator for your ICP and persona, and moves you toward your “Future Us” scores on the customer attributes you chose earlier. For example, in one quarter a strategic deliverable for Ease of setup might be:
“Clay can deploy a new display, from box to working screen with relevant content, in under 10 minutes without help.”
In another quarter, for Fresh school-specific content:
“Every K-12 customer automatically receives at least one new, relevant template pack each week that fits their school calendar.”
For Best Vendor Experience:
“NPS > 60 for K-12 support interactions, with Touch analysis completed on 90% of tickets, and Clay consistently reports that ‘Rise is the easiest vendor I work with’ in follow-up interviews.”
Each of these is written from Clay’s point of view and, once it is achieved, it becomes a permanent block in your strategy wall: a capability your machine now has that it did not have before. Next quarter you build the next block; you don’t keep ripping out the old ones and rebuilding them because you heard a clever new angle on a podcast.
Each of those deliverables sits in the lane of the Differentiator it primarily advances, but for that quarter there is only one that counts as strategic – and it is always framed from the point of view of your ICP and persona (Clay), not from your org chart. Everyone should be able to answer the question: “What is the one thing we are in service of this quarter, and why?”
The lanes still matter even with a single strategic deliverable per quarter. Over 12 quarters, each Differentiator has a visible trajectory: you can see which quarters it gets the spotlight, which quarters it is supported indirectly by enabling work, and how, over three years, your Differentiators are meant to mature for your ICP. The Activity Fit Map tells you “these are our Differentiators and the activities behind them.” The Strategic Swim Lanes tell you “this is when, quarter by quarter, those Differentiators will take their next leap for our Ideal Customer and for Clay.”
In practice, the Strategic Swim Lanes become the spine of planning. Each year you roll the view forward so you always have 12 quarters visible; each quarter you look at the next quarter’s one strategic deliverable and ask two questions: “If we achieve this, will life be meaningfully better for our ICP and for Clay?” and “What has to be true by the end of this quarter for us to say this is done?” The answers drive your projects and resource allocation. If a proposed initiative does not clearly support that deliverable, that Differentiator, and that ICP, it is not strategic this quarter. It might still be important, but it goes into operations or onto a parking lot for a future cycle. The discipline is that you do not quietly add “just one more” strategic thing without removing or redefining the existing one.
The answers drive your projects and resource allocation. If a proposed initiative does not clearly support that deliverable, that Differentiator, and that ICP, it is not strategic this quarter.
Strategic Swim Lanes also act as another reconciliation point. If you keep finding “must-do” work that does not fit under any Differentiator, you may have mis-grouped activities in the Activity Fit Map or be clinging to legacy work that no longer serves your ICP. If you struggle to define meaningful strategic deliverables that clearly matter to your Ideal Customer and to Clay, you may need to revisit the ICP, the Attribution Framework, or even the Target Market and Market Map. If new information from the Market Map or from conversations with your ICP suggests a different Differentiator should matter more, you adjust the lanes and then check upstream to ensure everything is still consistent.
In short, taking Shannon Susko’s swim-lane concept and applying my own bias for focus, Strategic Swim Lanes are a 3-year, quarter-by-quarter expression of your Differentiators for your Ideal Customer: one lane per Differentiator, and exactly one strategic deliverable per quarter across all lanes, defined from the perspective of your ICP and persona. Each 90-day deliverable is a new block in your strategy wall. Once it is in place, it becomes part of the machine, and you don’t mess with it unless the strategy itself has changed. That discipline is what turns Differentiators from labels on a diagram into intentional, time-phased changes in the business that Clay – and customers like him – can actually feel.
Putting The Strategy To Work
The above defines your strategy and what you must do to realize it. How you operationally organize to always drive towards this north star, measure progress, learn and adjust, will be covered in future posts. To follow along please subscribe using the button in the top right.