
Most founders carry their market in their head. Every leader on the team carries a different version of it. The Market Map puts one version on one page, where the whole team can see it, argue with it, and correct it.
The problem
Ask each of your leaders to name your competitors. Then ask who your customers could switch to without buying from anyone at all. Then ask which single customer, channel, or supplier could hurt you most if they walked away. You will get different answers from every seat.
That is not a knowledge problem. It is a visibility problem. Each leader sees the slice of the market their function touches. Sales sees the competitors that show up in deals. Operations sees the suppliers. Finance sees where the money concentrates. Nobody sees the whole field at once, so strategic decisions get made on whichever partial picture is loudest in the room.
When a leadership team draws their market for the first time, someone is always surprised. A customer concentration risk nobody had said out loud. A channel that quietly controls access to half the market. A supplier who could turn the business off tomorrow. The gap between where you think you stand in your market and where you actually stand is the reason this tool exists.
The Market Map is Shannon Susko's tool, described in 3HAG WAY. It is one of her Strategic Pictures: simple drawings that keep the strategy on the wall in front of the team instead of buried in a document. What follows is how I build and use it.
Market Map Builder
Builds your whole map in one AI-guided sitting: every player, the percentages, the risks and open space. Works from your data or your estimates.
What a Market Map is
A one-page picture of your playing field. It shows every player in your market and the relationships between them.
On the demand side sit your customers. Not just the ones you serve today. Every buyer segment in the market, whether you are in business with them or not. Between you and them sit the channels: the resellers, referrers, and partners that reach those customers. Some you use, some you don't, but they are all players on the field, so they all go on the map.
On the supply side sit the suppliers and platforms you depend on to deliver: technology, content, hardware, data, whatever your business runs on. Around the edges sit the influencers, the trade associations and communities that shape how buyers think. And across the whole field sit your competitors and substitutes, including the two substitutes most teams forget: "do nothing" and "build it themselves."
There is one more layer, and it is optional: the strategic acquirers, the companies that might one day buy you. It is drawn dashed on the map below because it only belongs there if an exit is part of your plan. It is also my own addition to Shannon's tool, and I explain it further down.
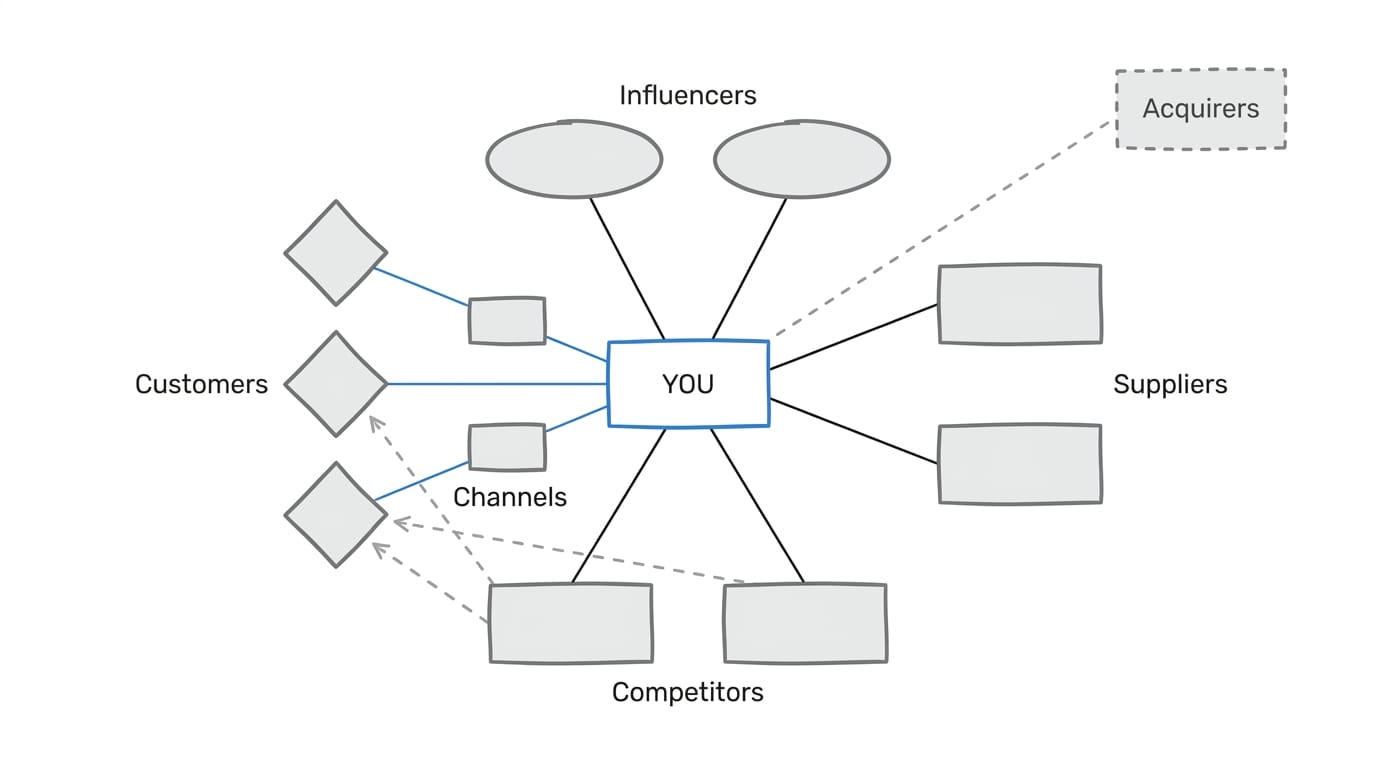
The map is deliberately rough. A big sheet of paper and sticky notes work. So does a shared canvas like Mural or Lucidchart if your team is remote or simply prefers digital. The medium does not matter. What matters is that the map stays editable and looks like something your team drew, because that is what makes them willing to change it.
How to draw it
Draw it with your leadership team, together, in a room or on a shared canvas. Do not delegate it to one person. Before anyone draws, have each leader write their own list of players in silence. Compare the lists. The differences are the first finding. Then work left to right.
- Draw a box in the middle of the page with your company's name in it.
- On the left, map every customer segment in your market, including the ones you don't serve yet.
- Between you and the customers, add the channels: resellers, referral sources, partners. Don't stop at the ones you use. Add the channels your competitors reach customers through, and the ones nobody has claimed yet. This is where opportunities you didn't know existed show up.
- On the right, add your key suppliers and the platforms you depend on. This is where your money goes out.
- Across the top, add the associations and influencers relevant to your market.
- Add your competitors and substitutes, then draw their relationships to the same customers and channels. Where their lines overlap yours, you are competing head on. Where they don't, there may be open space.
- Draw your own relationships, then follow the dollar. Put arrows on the lines showing which way money flows, and estimate the percentage of your revenue moving through each channel or customer group. Rough numbers are enough. You are looking for concentration, not precision.
- Circle what worries you and what excites you. Concentrations, dependencies, gatekeepers, and gaps.
- If an exit is anywhere in your future, add the strategic acquirers as a dashed layer. Place each one where it is strong today and mark its gaps. More on this below.
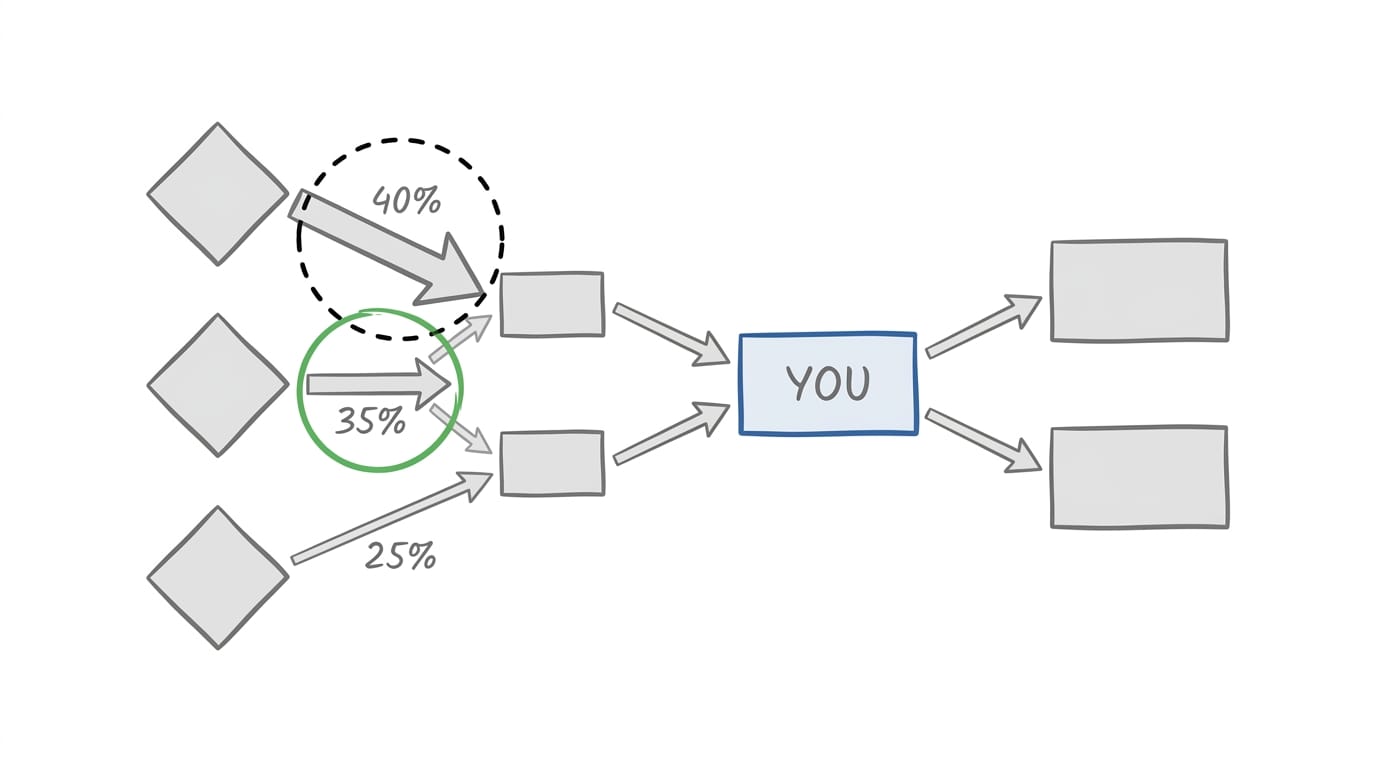
The percentages matter more than they look. In the map above, the dashed circle marks the worry: 40 percent of revenue flowing through one relationship with no contract behind it. The green circle marks a strength: a channel under contract that you can build on. When the map says these things, everyone in the room sees them at the same time, and the conversation changes in a way a spreadsheet never forces.
Market Map Builder
Walks you through every step above: customers, channels, suppliers, competitors, influencers, and the optional acquirer layer.
What the map tells you
Three things, if you let it.
Where the power sits. Every market has players who can say yes or no to your growth: a gatekeeper channel, a dominant supplier, a customer who is too large a share of revenue. The map makes each of these visible as a circle you cannot ignore. My previous company, Rise Vision, sold digital signage to K-12 schools. When we drew our field, the map showed us where channel partners held power and where we depended on relationships we did not control. Each of those circles became work: build the direct relationship, add the second supplier, sign the contract.
Where the open space is. Overlap is the enemy. If your lines to customers and channels look identical to your competitors' lines, you are competing to be the best at the same game, and that is a price war waiting to happen. You want the parts of the field where your relationships reach customers theirs do not, or serve needs theirs cannot. For us the open space was clear: competitors were over-invested in features and complexity, and schools were under-served on content and support. That gap became the strategy. Finding that gap means knowing a handful of competitors cold, not all of them. That deeper study is the Competitor File.
Whether your target is reachable. The map is a sanity check on where you have chosen to play and on who you have chosen to serve. Your Core Customer has to live somewhere on this map, in a segment you can reach at a profit. If the path to your target market runs through hostile channels, entrenched gatekeepers, or dependencies you cannot afford, you have probably chosen the wrong target. Better to find that out on paper. When we drew the K-12 market, the map confirmed the field was reachable and nobody had locked it up. That confidence is worth as much as the risks the map exposes.
If you ever plan to sell
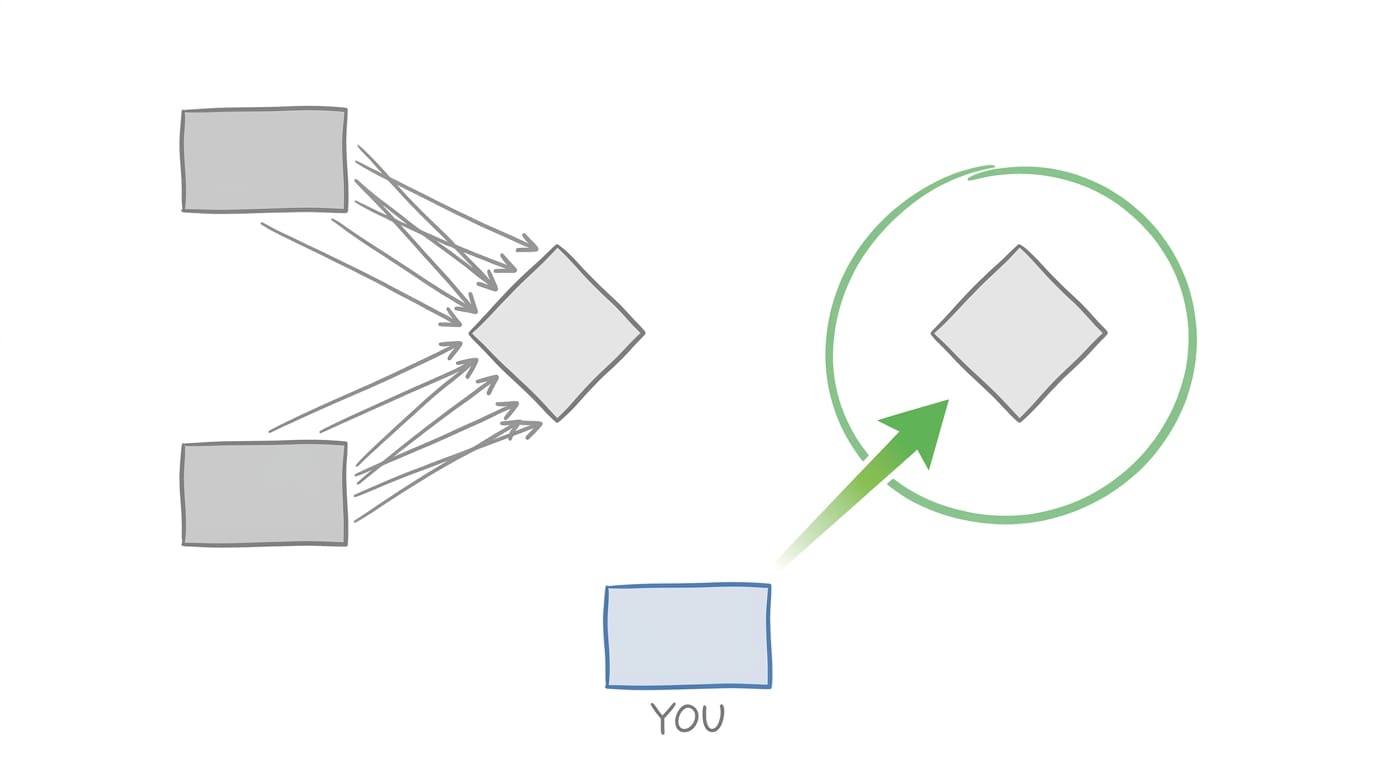
One layer you will not find in the books: the strategic acquirers. If a sale is ever a consideration for you, this is one of the most important layers on the map. Who are the companies in your industry that would value what you do? Put them on the map exactly where they are strong today, which segments, channels, and geographies they already own, and mark their gaps.
Strategic buyers tend to pay more than financial buyers. They are buying a position in a market, not just your cash flow. If your 3 Year Highly Achievable Goal [3HAG] includes an exit, your job is to build a position on this map that makes you uniquely valuable to one of them: dominating a segment they want, owning a channel they lack, or solving a problem their current offer cannot. I wrote more about this in How I Would Sell A Business.
Keep it on the wall
The Market Map is not a workshop artifact. It is a working document, and it decays fast, because markets move.
The rhythm that worked for us: at every quarterly planning session, bring the map up to date and pull from it up to three opportunities to pursue or threats to mitigate. Those feed directly into the quarter's priorities. Between quarters, the map hangs where the leadership team meets. When someone mentions a new competitor or a channel shift, it goes on the map in the meeting, not in a document nobody reopens.
If the map gets too full, that is a good sign. Draw a global map and then separate maps per region or segment. One page is still the limit for each. If a player would not change a decision you make, leave that player off. And keep it rough, whether that is sticky notes and marker or their digital equivalents. A polished map stops being edited.
What comes next
The Market Map is the outside view. The Key Function Flow Map is the inside view: how work and money flow through your own company. You need both pictures, because strategy is deciding where the outside world and your inside capabilities meet.
From here the map feeds the next two strategic pictures. It confirms, or challenges, the Core Customer you have chosen. And the risks and opportunities you circled feed the Attribution Map, where you choose the attributes you will win on. If a dependency on the map can be reduced by getting better at one attribute, that attribute just became strategic. The pictures are designed to challenge each other. When they disagree, one of them is wrong, and finding out which one is the real work of strategy. The map also names the competitors worth studying in depth, and the Competitor File is where you do that study.
Where are you playing? If your leadership team cannot answer that on one page, draw the page.
Market Map Builder
Everything in this article as one guided exercise. The map, the player inventory, and the risks and opportunities for your next planning session.
The Market Map is Shannon Susko's tool, described in 3HAG WAY and Metronomics as one of the Strategic Pictures that keep a company's strategy visible and evolving. What I describe here is my application of her framework, informed by using it at Rise Vision and coaching it in founder-led companies. The strategic acquirer layer is my own addition. All credit for the underlying framework goes to Shannon. Any mistakes or distortions are mine. I strongly recommend reading the originals.
- Values - How Not To Chase Your Tail
- How to Discover Your Company's Values Using AI
- How Your Company Makes Money
- Scoreboard Day And The Weekly Leadership Review
- Compensation
- Severance
- Skip Level Reviews
- The Eight Meetings That Run Your Company
- Who On Your Team Is An A-Player?
- Where Are You Going?
- Who Is Your Most Valuable Customer?
- Competencies: The End of Personality Reviews
- Scorecards: The End of Directive Management
- Where Are You Playing?
- Who Are You Really Competing With?