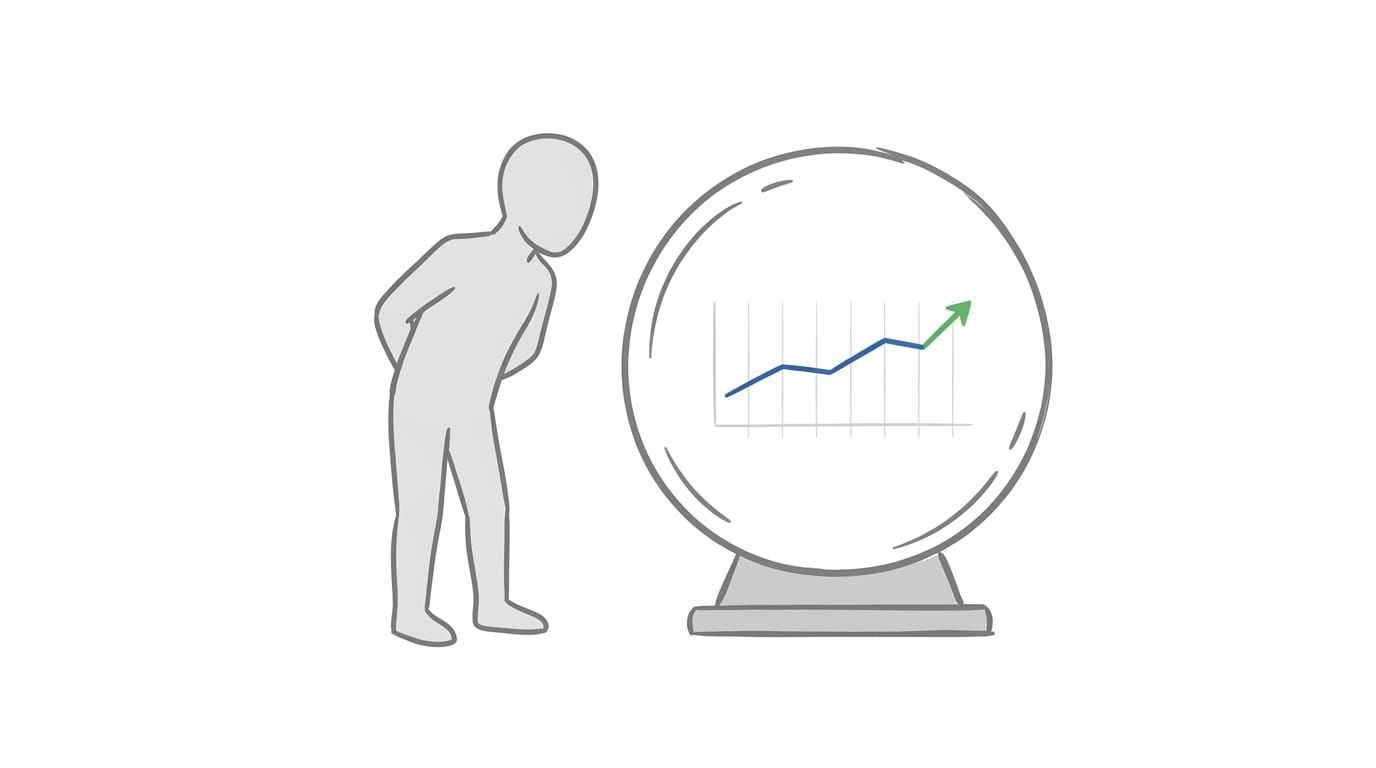
When I ran my company, we worked from a 36 month cash plan: the cash we intended to have in the bank, month by month, for the next three years. Two months into the year, I knew whether we were going to hit a number that was still 34 months away. That early answer was rarely wrong. Every leader on my team knew their part in hitting it, and what they would account for if their number slipped. None of that came from better financial reporting. It came from the plan itself: a rolling forecast built from numbers my leaders already owned.
Most companies work from a budget and financial statements. A budget is usually a desired goal, or last year's numbers plus a growth target, spread across 12 months. It can set a useful target, but it is poor at predicting cash because it rarely reflects how work and money actually move through the business.
Financial statements tell you what already happened, usually two to ten weeks too late to change it. They can show where cash came from and where it was used, but they do not easily reveal the operating drivers that produced the result.
Most companies also treat cash as a finance issue. Finance forecasts it, reports it, and answers for it, but finance does not control the variables that move it. Those variables are the work itself: the leads generated, deals closed, work completed and invoices collected. The person accountable for the cash number and the people doing the work that produces it are often different people. That disconnect is why cash problems surface late and land on the wrong desk.
The cash system closes that gap by mapping how your company makes money, input by input. It shows what must happen at every step, how much must move from one function to the next, what percentage must convert, how long each step takes, and what capacity and resources are required. That is what turns a first expression of interest into cash in the bank.
Mapping it also forces you to say who owns each piece, so accountability does not dilute as the company grows. The mechanism is the same whether there are two of you or two hundred. What changes is how many names are on the map. Either way, you can answer one question at any moment: how much cash will be in the bank, month by month, between now and your three year goal? When the answer starts to slip, the system says so within days, shows where in the chain it broke, and names who owns the correction.
Forecast Cash First
The cash system comes from Metronomics, Shannon Susko's operating system for growing a company. I ran my company on it and coach with it now. Forecast the cash you want in the bank at the end of every month, all the way out to your 3 Year Highly Achievable Goal (3HAG). Then forecast the widgets that produce it.
Widgets are the countable things that flow through your business and that your team controls. Leads generated. Deals closed. Units shipped. Jobs bid and jobs won. Change orders approved. Appointments booked. Customers onboarded. Customers renewed. You find them on your Key Function Flow Map (KFFM), the one page map of how your company makes money: the handful of functions the work flows through, and what passes between them. What passes between them are the widgets. Its companion chart, the Functional Accountability Chart (FAC), gives each function an owner. That is why the pair matters to cash. It turns one number finance answers for into a chain of numbers specific people control.
The KFFM also supplies the timing rules for the forecast. Marketing timing, sales close timing, delivery timing and collection timing are entered in days. The model adds those days through the flow and places the resulting revenue, costs and cash in the month when each event will occur. The spreadsheet is therefore not imposing a timing assumption on the business. It is calculating the financial result from the way the business actually works.
This makes the KFFM more than a description of the business. Its quantities, conversion rates, timing, capacity and resource requirements become forecast inputs. They are also the levers the owner can use to manage cash.
Finance translates the widgets into revenue, cost of goods sold, expenses, profit and cash, and carries the cash items no widget drives directly: taxes, equipment purchases, debt payments, owner distributions and other cash in. People are often the largest cost, so hires go in by role and by month, each one justified by the widgets and capacity it serves.
Nobody forecasts eight percent growth on revenue and leaves it there. Growth arrives in the model only if some widget somebody owns says where it comes from. That includes the idea you fell in love with last week.
It pays its way in widgets or it waits.
This is where the accuracy comes from. Saying you want ten percent more revenue tells you nothing about whether you can get it, so a forecast built that way is a wish with a number on it. Widgets tell you. How many more leads does that take, and can marketing generate them? Can sales close them at the price you assumed? Does delivery have the capacity to serve them, and if not, who do you hire and in which month? What would you have to buy, and when does it leave the bank? Sometimes the honest answer is that the number is not available this year at any price, and it is far better to learn that in planning than in October.
Finance builds the model and is its keeper. In a small company, finance is you and your bookkeeper. The role matters, not the title. The leaders own the assumptions inside it. Marketing forecasts leads. Sales forecasts closes. Operations forecasts delivery. When the forecast is wrong, the team can see which assumption moved and who owns it.
Cash Forecast Templates
12 month and 36 month models in Excel and Google Sheets.
The Same Widgets at Three Frequencies
The FAC gives each function one number that says whether it is doing its job, and the thresholds that say whether it is healthy. That is its critical number.
The three year model, the monthly review and the weekly scoreboard all run on the same widgets. You are not keeping three sets of numbers, one for the plan, one for the month and one for the board.
The three year model sets what each function must produce, month by month, for the cash plan to hold. The monthly review compares what was actually produced against that plan, and the model shows what the difference does to the future. The weekly scoreboard checks the same numbers every week, so when a function falls behind you know within days.
The weekly targets are taken from the Approved months in this model, which makes every weekly update a report against the forecast whether the team thinks of it that way or not. Scoreboard Day covers how.
The same widgets operate at three frequencies. Approved is locked once a year. Actual results replace the plan as each month closes. Rolling is calculated automatically from Actual to date and Approved for the months ahead. The weekly scoreboard shows whether the work required to protect that future is happening now. The sooner you see the gap open, the cheaper it is to close.
Actual, Rolling, Approved
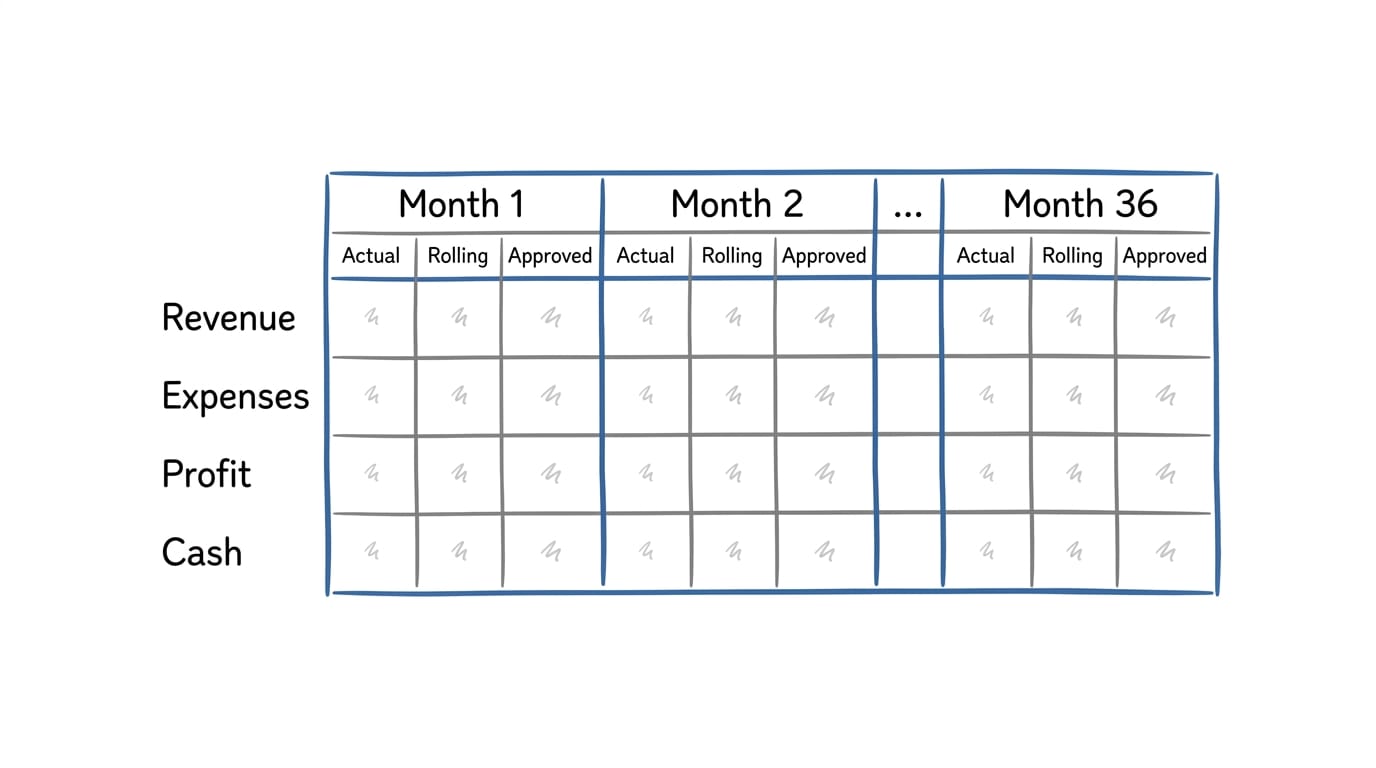
Every month in the model carries three columns.
The Approved column is the plan the leadership team locked at the start of the fiscal year, covering the full 36 months. It holds, unchanged, until the next annual planning locks a new one. The Actual column records what happened, month by month, as results come in.
Rolling is the automatically calculated view of the future. It uses Actual for every closed month and Approved for every month still ahead. When Actual differs from Approved, the cumulative difference carries through every later month and changes the future cash position. A small variance today therefore remains visible all the way to month 12 or month 36.
You enter Actual. The model calculates Rolling. You do not rewrite Approved in the middle of the year. The gap between Rolling and Approved is not embarrassment, it is information. It shows what has already changed, what that does to the future and how much correction is now required.
A complete worked example of all of this, built as a spreadsheet, is available below. It includes the KFFM drivers, the standard Revenue, Cost of Goods Sold and Expenses layout, and the cash adjustments needed to reconcile profit to cash.
Cash Forecast Templates
12 month and 36 month models in Excel and Google Sheets.
Detection Happens Weekly
Finished financial results are not available until the books are closed and the statements are out. That is commonly two to ten weeks after the work happened. Widgets are counted by the people doing the work, as the work happens. That is why the system runs on widgets.
A company run on financial statements finds out late. The statements can confirm the result and help explain sources and uses of cash, but they still do not show the operational chain clearly. A miss on the profit and loss statement could have a dozen origins.
Widgets do tell you. A red widget sits on one function, so you know where the miss first appeared and who owns the correction, and you know it while the month is still running. The financial statements arrive later and confirm what the scoreboard already caught. What happens to that red number is the subject of Scoreboard Day.
Here is what that looked like in the model that ships with this article. February closed 11 new customers against a plan of 19. Those 11 came out of the 76 leads January had accepted, because a lead takes a sales cycle to close, so the real number underneath the miss was a close rate of 14.5 percent against an assumed 26. Follow it forward and the cash at December 2028 is 779,265 dollars lower than the plan. Two months into a three year plan, before anyone had closed a set of books, the owner already knew.
That leaves the monthly meeting one job. Actuals go in and Rolling recalculates the future position automatically. The team compares that future with Approved, uses the widgets to find where the variance began, and decides what to change now while there is still time for the change to work. Ours took an hour, and it could be that short because it looked forward only. Accountability already happened during the week. If your monthly financial review is tense, your weekly system is not doing its job. Ours got boring. Boring was the goal.
How to Start
Start with the KFFM. Name the functions, the widgets that move between them, the quantity required, the conversion rate from one step to the next, and the timing in days. Then use the FAC to give each function an owner and a critical number.
Build the 12 month forecast first. Use the standard financial structure: Revenue, Cost of Goods Sold and Expenses. Add the cash items that do not appear in the profit and loss statement, including tax, equipment, debt principal, owner distributions and other cash in. Connect the KFFM inputs and timing to those accounts so the model places each result in the month when it will happen.
Run the monthly review until the conversation is about the causes of variance and the corrective action, not the spreadsheet. Extend the model to 36 months when that 12 month rhythm holds.
If you already run a monthly financial review, build the forecast into that meeting rather than creating a new one. A meeting that already has discipline and attendance makes the forecast stick. A forecast cannot make a meeting stick.
Cash Forecast Templates
12 month and 36 month models in Excel and Google Sheets.
What Happens at Year End
Every year you add another twelve months to the plan and redo the forecast. The raw material is already there: the current Approved plan, a full year of Actual results and the variances the team has been managing. At annual planning the team refines the next 24 months, adds twelve new months at the end, costs the plan against the new 1 Year Highly Achievable Goal (1HAG) and 3HAG, and approves the full 36 months. That approval locks the new Approved numbers until the next annual plan.
By the time annual planning arrives, the next year's plan has already been tested by a year of operating evidence. The annual meeting confirms a plan the team believes, because the team understands the drivers behind it.
The Answer
So who owns the forecast? Nobody owns all of it. It splits three ways.
Finance owns the model. It builds it, keeps it honest, and answers for two numbers of its own: the cash it collects and how accurate the forecast turns out to be.
The leaders own the assumptions inside it. Marketing owns the leads. Sales owns the closes. Operations owns the deliveries. Each of those is a commitment a named person made and checks every week.
The CEO owns the total. Cash is the result of every trade-off between growth and profit, so it belongs to the person making those trade-offs.
That is the disconnect closed. The people responsible for the work and the person accountable for the cash are no longer strangers to each other's numbers. A problem has nowhere quiet to sit between them. It shows up as a red widget with an owner's name beside it, days after it starts, while Rolling shows its effect on every future month.
If you are ever considering an exit, a buyer will want to know whether your forecast has ever been right. Being able to answer that, month by month, with the misses still in the record, puts you in a better position than a company that cannot.
But the daily prize is bigger. You stop being the only person who knows whether the company will be okay. The future stops living in your head and starts living in a model your whole team built, tests every week and updates with Actual every month. By month two, we knew. That is what it means to own the forecast.
The cash system, widget based forecasting and the 36 Month Rolling Forecast are Shannon Susko's work, from Metronomics and 3HAG WAY. What I have described is how we ran them at Rise Vision and how I coach them now.
Related articles:
- How Your Company Makes Money covers the KFFM and FAC.
- Scoreboard Day covers the weekly detection rhythm.
- The Eight Meetings That Run Your Company covers the monthly meeting.
- Where Are You Going? covers the 1HAG and 3HAG.